Tripoli District, Lebanon
Tripoli District | |
|---|---|
District | |
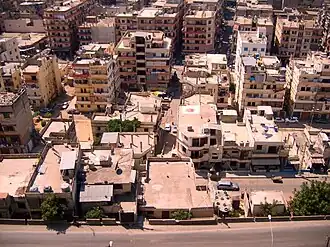 A neighborhood in east Tripoli | |
  Tripoli District Location in Lebanon | |
| Coordinates: 34°26′N 35°51′E / 34.433°N 35.850°E | |
| Country |  Lebanon Lebanon |
| Governorate | North Governorate |
| Capital | Tripoli |
| Area | |
• Total | 17 sq mi (45 km2) |
| Population | |
• Estimate (31 December 2017) | 342,760 |
| Time zone | UTC+2 (EET) |
| • Summer (DST) | UTC+3 (EEST) |
The Tripoli District is a small, but very densely populated district in the North Governorate of Lebanon. It consists of the city Tripoli, its port town El Mina and the surrounding area. The vast majority of residents are Sunni Muslim (approximately 80%), a small minority Orthodox and Maronite Christians, and a small minority of Alawites.
Municipalities
Demographics
According to registered voters in 2014:
| Year | Christians | Muslims | Druze | ||||||||
|---|---|---|---|---|---|---|---|---|---|---|---|
| Total | Greek Orthodox | Maronites | Armenian Orthodox | Greek Catholics | Other Christians | Total | Sunnis | Alawites | Shias | Druze | |
| 2014[1] | |||||||||||
| 2022[2] | |||||||||||
| 2026[3] | |||||||||||
Number of registered voters (21+ years old) over the years.
| Years | Men | Women | Total | Growth (%) |
|---|---|---|---|---|
| 2009 | 101,783 | 94,366 | 196,149 | N/a |
| 2010 | 103,058 
|
95,484
|
198,542
|
+1.21%
|
| 2011 | 104,023
|
97,088
|
201,111
|
+1.28%
|
| 2012 | 105,619
|
98,842
|
204,461
|
+1.64%
|
| 2013 | 108,146
|
99,911
|
208,057
|
+1.73%
|
| 2014 | 109,984
|
102,111
|
212,095
|
+1.90%
|
| 2015 | 111,873
|
103,951
|
215,824
|
+1.73% 
|
| 2016 | 113,433
|
106,755
|
220,188
|
+1.98%
|
| 2017 | 119,782
|
113,158
|
232,940
|
+5.47%
|
| 2018 | 122,029
|
115,301
|
237,330
|
+1.85%
|
| 2019 | 124,301
|
117,235
|
241,536
|
+1.74%
|
| 2020 | 126,630
|
119,730
|
246,162
|
+1.88%
|
| 2021 | 128,539
|
121,534
|
250,073
|
+1.56%
|
| 2022 | 130,768
|
123,670
|
254,438
|
+1.72%
|
| 2023 | 132,476
|
125,161
|
257,637
|
+1.24%
|
| 2024 | 134,308
|
127,089
|
261,397
|
+1.44%
|
| 2025 | 136,282
|
128,839
|
265,121
|
+1.40%
|
| 2026 | N/a | N/a | 269,167
|
+1.50%
|
| Source: DGCS [1] | ||||
References
- ^ https://lub-anan.com/المحافظات/الشمال/طرابلس/المذاهب/
- ^ "Mapping Lebanon: Data and statistics". today.lorientlejour.com (in English). 2022. Retrieved 2022-10-05.
{{cite web}}: CS1 maint: url-status (link) - ^ "Statify Lebanon". statisticslebanon.lb (in English). 2022. Retrieved 2022-10-05.
{{cite web}}: CS1 maint: url-status (link)
| Akkar Governorate | | |
|---|---|---|
| Baalbek-Hermel Governorate | ||
| Beirut Governorate | ||
| Beqaa Governorate | ||
| Keserwan-Jbeil Governorate | ||
| Mount Lebanon Governorate | ||
| Nabatieh Governorate | ||
| North Governorate | ||
| South Governorate | ||
Capital: Tripoli | |
| Towns and villages | |